The population of Colorado is comprised of 22% hispanic citizens, but 39% of the COVID-19 cases are afflicting hispanic
people, far outweighing any other ethnicity. In this project, I have explored trends in environmental factors, education,
and food availability in regions of the state with high hispanic populations to determine possible trends in these areas
to account for this disparity.
This project is in collaboration with Halvatzis Consulting and Colorado Hispanic Chamber of Commerce on Market Insights
Report # 1002 - Driving Equitable Growth in Colorado: A Look Back to Move Forward (full report currently work in
progress)
Hispanic Population/Density by County
This figure shows the percentage of hispanic people per county (shaded in blue) and the population of hispanics in said
county is labeled. The bar graph shows another representation.
The following map shows the maximum recorded air quality index level for each county in Colorado (where data has
been
recorded by the Environmental Protection Agency) in the year of 2018. The circles on the map represent the
percentage
(color) and population (size) of hispanic people per each county. Based on regional trends, it appears that the
center
of the state west of Denver has recorded unhealthy air qualities. This could be due to wildfires in the mountains.
Air Quality Index is an indicator of overall air quality, because it takes into account all of the criteria air
pollutants measured within a geographic area. AQI includes all available pollutant measurements from each monitoring
station. They include both qualitative measures (days of the year having "good" air quality, for example) and
descriptive statistics (median AQI value, for example) [Source: Environmental Protection Agency (EPA)]
2018 Median AQI Plot
This plot shows the median Air Quality index in 2018 for each county in Colorado that has data recorded from the
Environmental Protection Agency (EPA). There appears to be a positive correlation between the size of the population
and
the median air quality index level. It it worth noting that many of the counties exhibiting a higher AQI have high
hispanic populations. Both Adams County and Denver county show high hispanic populations and the highest median AQI.
Most Polluted Zip Codes in Colorado
The most polluted zip codes in Colorado, according to the Denver post, are plotted in the map below. The zip code
80216 has an extremely high environmental hazard index, and also a very high concentration of hispanic people. The next
most polluted zip codes do not appear to be nearly as hazardous, but generally have a smaller percentage of hispanic
residents.
Food access analysis based on data provided by the Colorado
Department of Public Health and
Environment
Shown is a map of low access, low income census tracts throughout the city of Denver, and the percentage of people
affected. The circles on the census tract areas represent the population of hispanic people. Low-income census
tracts
where a significant number (at least 500 people) or share (at least 33 percent) of the population is greater than
1.0
mile from the nearest supermarket, supercenter, or large grocery store for an urban area or greater than 10 miles
for a
rural area [Source].
There are two areas of concern, colored orange and red that have high levels of low access. It is worth noting that
the
orange area is also inside zip code 80216, which has a population that is about 80% hispanic. The zip code 80216
also
has very high levels of air pollution.
Metro Denver Low Access (1 mile)
This map represents metro Denver census tracts and the tracts that are considered low access. There are several
census
tracts with low access and high hispanic populations.
Denver Low Vehicle Access
This map represents metro Denver census tracts that are low access and a signicant number of people have low access
to a
vehicle. It does not appear that the lack of vehicle and low access affects the hispanic population exclusively.
Low Access (20+ mile) and No Vehicle Access
This plot represents the census tracks in Colorado that are more than 20 miles away from the nearest grocery store
or
supermarket and have little to no vehicle access. Although not a large quantity of hispanics fall into this
category, it
is worth noting that the census tracts with the highest percentage of housing units effected also appear to be
largely
hispanic communities. Costilla County contains the top two census tracts with the highest levels.
This map shows the class of 2019 graduation rates of hispanic people over the counties of Colorado, based on
data from
the Colorado Department of Education. There appears to be much lower
rates in rural
counties, though few of them are highly hispanic.
This plot shows that there appears to be a negative trend in graduation rates as the population increases. Also,
it is
important to note that the hispanic graduation rate is considerably lower than that of all compiled races. This
disparity seems to get larger in counties with higher population. It may be possible that hispanics in urban
counties
aren't getting the educational resources they need to succeed.
Graduation Rates by Ethnicity
This bar plot represents the race/ethnicity breakdown of high school graduation rates in the county of Denver.
Again,
hispanics have graduation rates below the other major races, and they appear worse in Denver county.
This bar plot represents ethnicity/race breakdown of female graduation races throughout the state and in Denver
county.
Again, hispanics seem to have lower graduation rates than those of other ethnicities in Colorado.
This bar plot represents ethnicity/race breakdown of male graduation races throughout the state and in Denver
county.
Male hispanics seem to have lower graduation rates than those of most other ethnicities as well. It is worth
noting that
the graduation rates are significantly lower in Denver than throughout the whole state.
Hispanic Graduation Rates by Gender/County
From this bar plot, hispanic females seem to have much higher graduation rates than hispanic males. It is
interesting
that Pueblo County has higher graduation rates for Hispanic males and females than average - this is the only
highly
populated county in the state to show this trend.
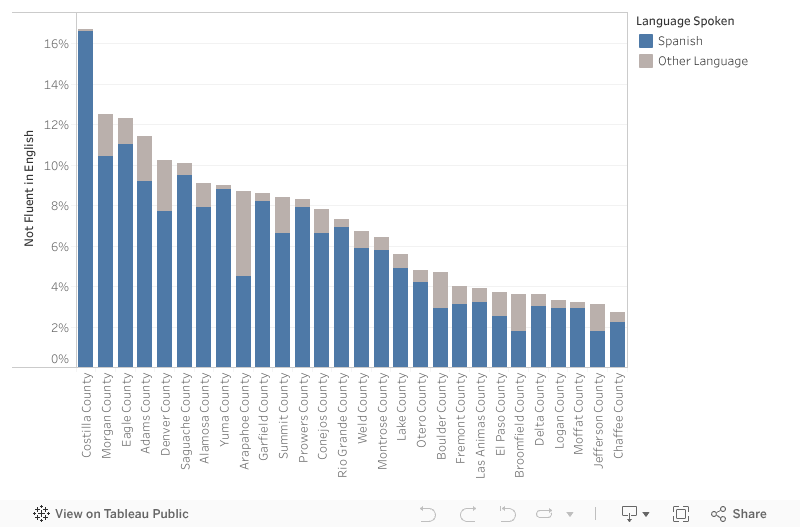
English Non-Fluency by County
This map shows the average percentage of people per county that do not speak fluent english, according to US
Census
data. Many of the higher rates of nonfluency are in areas of high hispanic concentration.
This bar plot shows the percentage of non-english speakers in the counties in colorado with the highest
concentration of
those not fluent in English. Spanish is definitely the most common non-english language spoken throughout these
areas.
Conclusion
There appears to be several regions in the state of Colorado where hispanics may be more vulnerable to COVID-19 due to poor air quality, low food access, lack of quality education, and English non-fluency. Since the zip code 80216 has been found to have several problems including low food access and very high pollution, the data can be used to influence policymaking in this area to help the hispanic community. Also, based on the fact that several of the highly hispanic counties in Colorado also have worse air quality, we should influence policymaking the improve the air quality in these areas. In terms of education, the downwards trend and extent of disparity between graduation rates and county population is a possible indicator that urban hispanic students may need assistance getting the educational resources and support that they need. By addressing these issues in these regions, hopefully we can begin to help the hispanic community become more resistant to COVID-19 and eliminate the racial disparity in cases.


